Quick Start
Note
The Workspace and Tools Setup, Import Application, and Create New Application panels support both Zephyr and bare-metal CMake/SDK projects. The Workspace and Tools Setup wizard detects the project type from the selected source and adapts its steps accordingly. You can also open an existing project folder via File → Open Folder and configure it with the Configure Settings panel (onsemi Studio Activity Bar → Configuration → Configure Settings) or by editing .vscode/settings.json directly.
Workspace and Tools Setup
Open the Command Palette (Ctrl+Shift+P) and run:
onsemi: Workspace and Tools Setup
Alternatively, open the Quick Start View in the onsemi Studio Activity Bar and click Development Environment Setup.
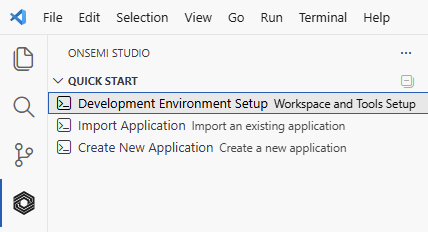
Fig. 1 Quick Start View in the onsemi Studio Activity Bar
This opens the interactive setup panel with two operation modes:
Express Mode - Fully automated installation (recommended for first-time users)
Advanced Mode - Granular control over individual tool selection and installation
Express Mode Workflow (Recommended)
Express Mode streamlines the setup process by automatically installing all required tools. The panel guides you through three main steps:
Step 1: Configure Repository
Select your workspace source type:
GitHub Repository: Enter repository URL and branch/tag, choose installation location, then click “Install” to clone
Local Archive: Browse to a zipped SDK folder, choose extraction location, then click “Install” to unzip and register
Local Workspace: Browse to an existing SDK/repository folder to register with the extension
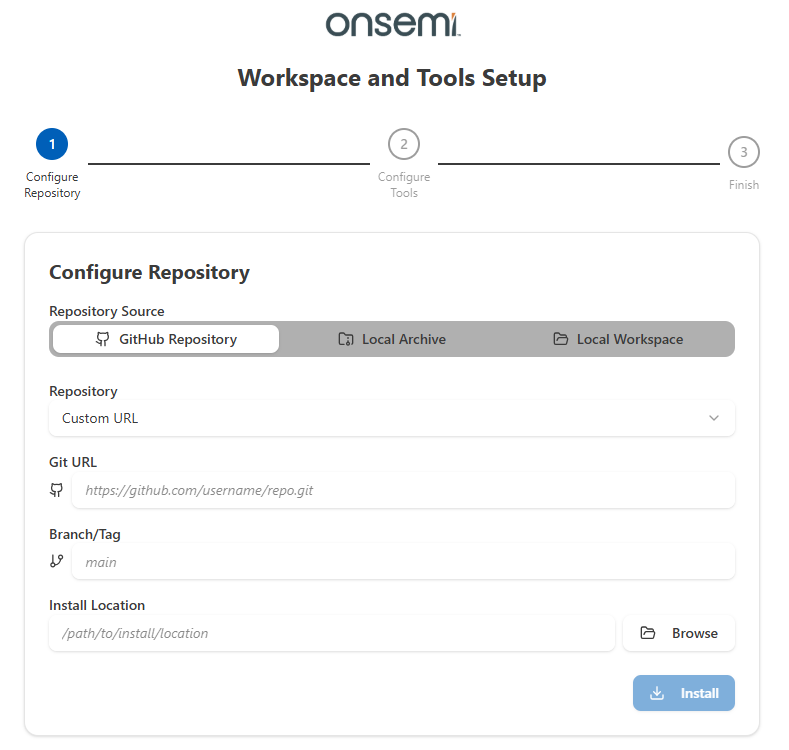
Fig. 2 Express mode configuration panel showing repository setup
GitHub Authentication
If accessing private repositories, you’ll be prompted to authenticate:
Complete the authentication steps in your browser
Once authenticated, return to VS Code
The extension will proceed with repository cloning
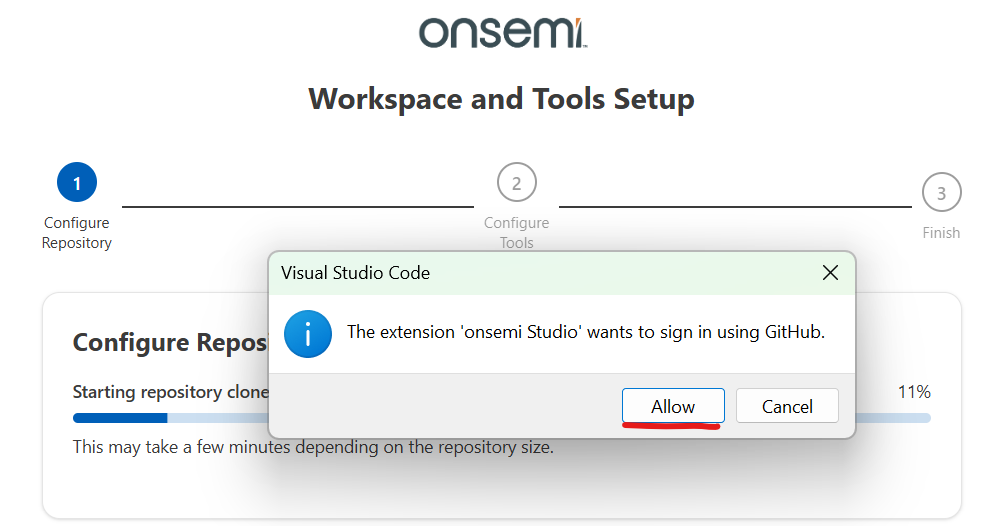
Fig. 3 GitHub authentication during workspace setup
Step 2: Configure Tools
The panel automatically identifies required development tools
All necessary compilers, debuggers, and dependencies are installed automatically
No manual tool selection needed
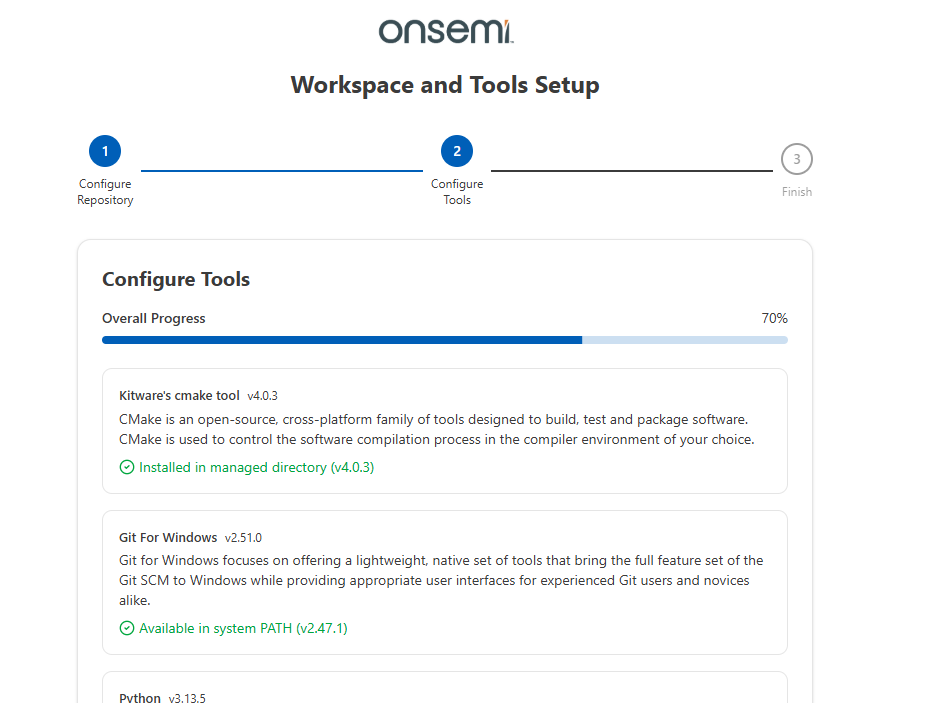
Fig. 4 Configure tools installation progress
Step 3: Finish
Verify installation summary
Complete setup and begin working with your projects
Note
The Workspace and Tools Setup wizard detects the project type from the selected source. For a Zephyr/West repository it installs the Zephyr SDK, Python environment, and West dependencies. For a bare-metal CMake/SDK source it installs CMake, Ninja, the ARM GNU Toolchain, and other tools listed in the SDK’s tools.json (or the extension’s defaults). To open an already-configured project that does not need new tools, use File → Open Folder and edit the project’s .vscode/settings.json directly or via the Configure Settings panel.
Import Application
Open the Command Palette (Ctrl+Shift+P) and run:
onsemi: Import Application
Alternatively, click Import Application in the Quick Start View (onsemi Studio Activity Bar).
The import panel guides you through:
Select SDK/Repository: Choose from configured SDKs/Repositories or browse for local folders/archives
Choose Toolchain: Select an existing toolchain or browse for toolchain installation path
Select Board Vendor and Target Board (Zephyr only): Choose the board vendor, then select the specific target board from the available options
Select Application(s): Pick one or more samples from the chosen SDK/Repository. Both CMake / bare-metal SDK and Zephyr sources support selecting multiple samples in a single import; failure on an individual sample does not abort the rest of the batch. For Zephyr imports, every selected sample is paired with the board chosen in the previous step.
Zephyr only — toggle the “Repo samples only” checkbox above the sample list to hide upstream Zephyr samples and show only samples discovered under the selected repository’s
samples/folder. Uncheck it to also see upstream Zephyr samples. A sample is recognized whenever its directory contains aCMakeLists.txt(asample.yamlis no longer required).
After import, the project is added to your VS Code workspace with:
Configured build settings in
.vscode/settings.jsonSelected toolchain and board
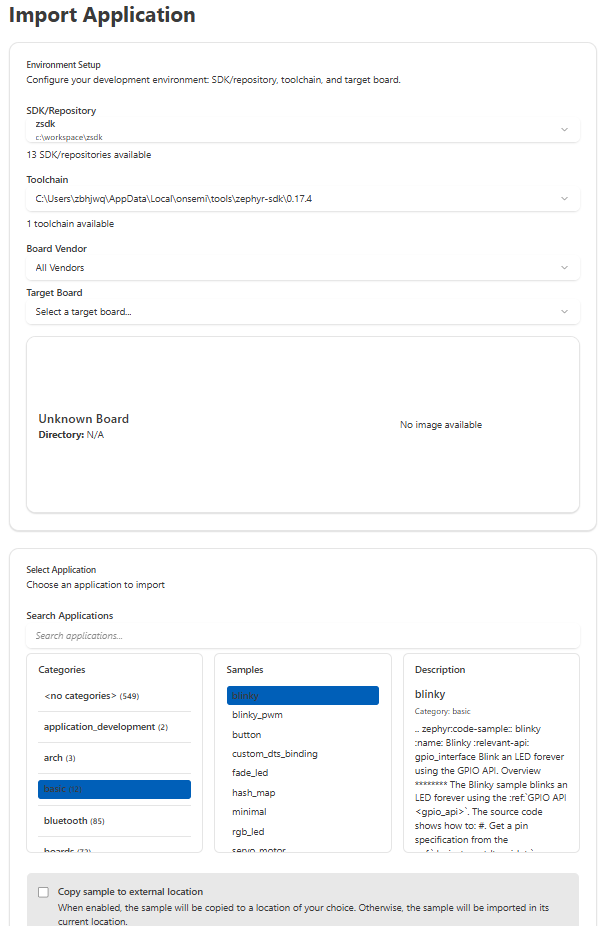
Fig. 5 Import Application panel showing workspace and sample selection
Tip
Copy Sample Option: When importing, you can enable the “Copy Sample” option to copy the sample to a different directory. This helps avoid long path issues on Windows and provides better organization.
Create New Application
Open the Command Palette (Ctrl+Shift+P) and run:
onsemi: Create New Application
Alternatively, click Create New Application in the Quick Start View (onsemi Studio Activity Bar).
Create a new application from scratch:
Select SDK/Repository: Choose the sdk/repository for the new application
Choose Template: Select whether to create an empty application or start from an existing sample (the “From Sample” tab is active by default)
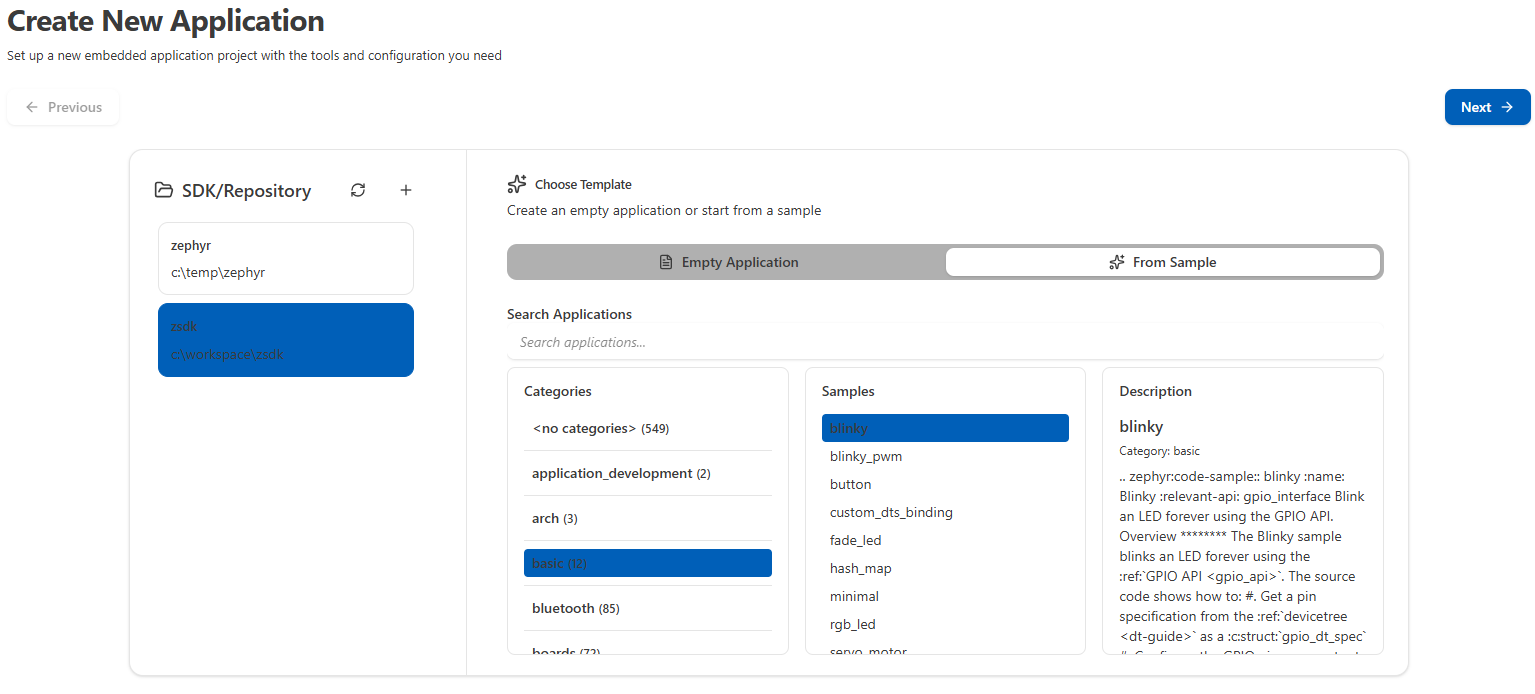
Fig. 6 Create New Application panel showing template selection
Configure Project: Enter the Application Name and Save Location for your new application
Environment Configuration:
Toolchain: Select the toolchain for building
Board Vendor: Choose the board vendor (Zephyr)
Target Board: Select the target board (Zephyr)
Click Create Application to create your new application
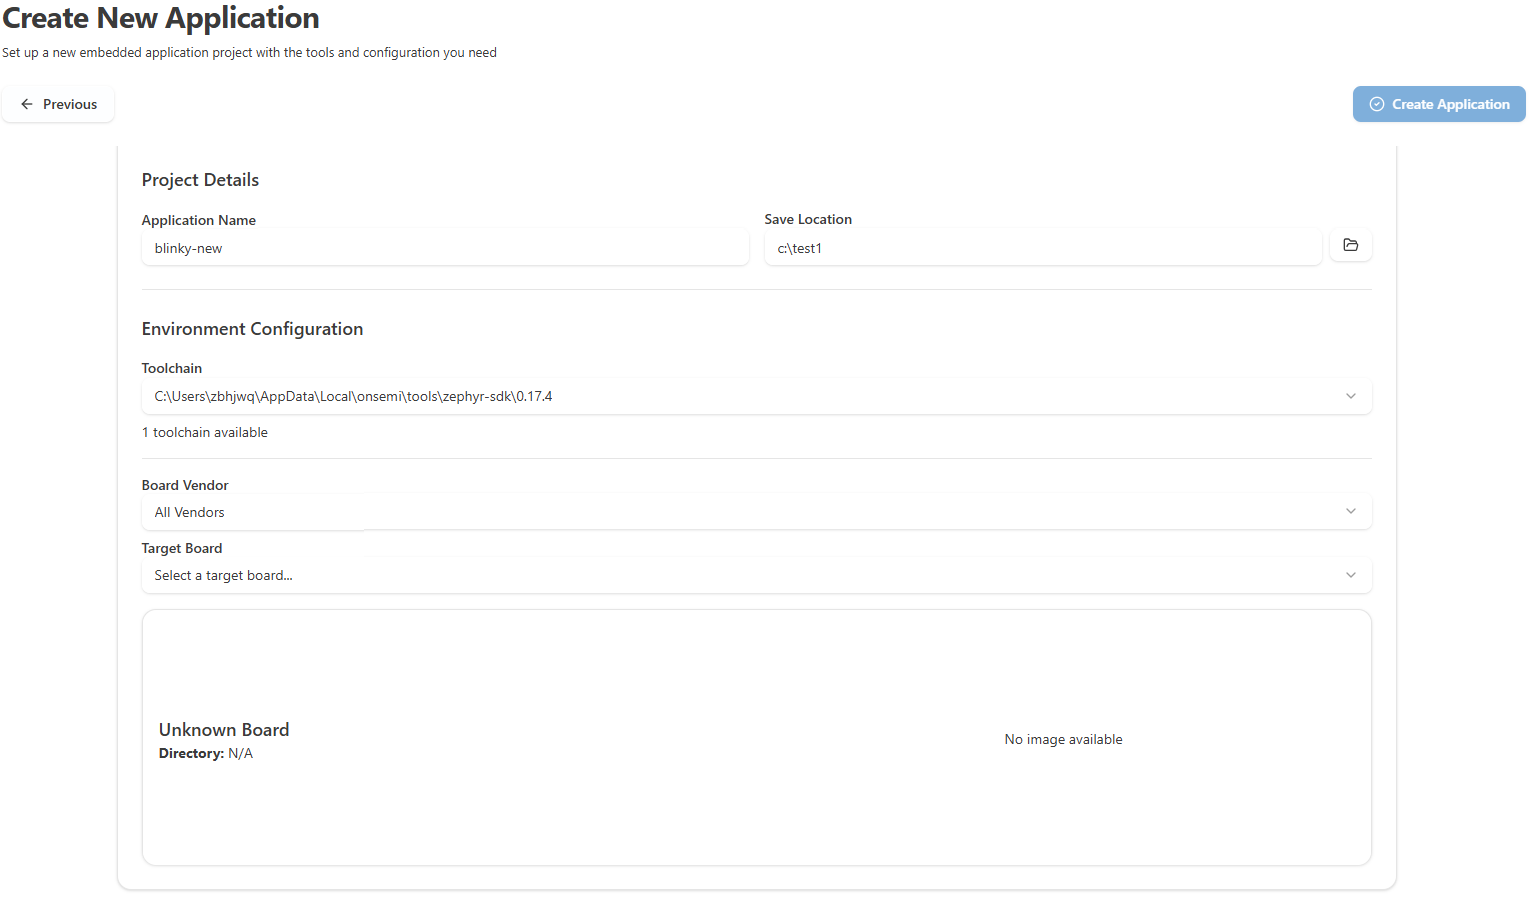
Fig. 7 Create New Application panel showing Configure Project and Environment Configuration
Working with Projects
Once you have projects in your workspace, you can:
From Explorer and onsemi Studio Activity Bar:
Right-click on project folders to access:
Build, Clean, Rebuild
Configure (CMake projects)
Flash (Zephyr projects)
Debug (Start debugging with active ELF)
Stop Task (cancels the in-flight build / configure / clean / flash for that project)
Memory Reports (Zephyr projects)
KConfig (
menuconfig/guiconfig) for Zephyr projects and for CMake projects that exposemenuconfig/guiconfigtargetsDebug Files submenu: - Select Active ELF - Clear Active ELF - Rescan ELFs
Open in onsemi Studio Terminal (Opens terminal with proper environment)
Application View
After importing or creating projects, they appear in the Application View with an organized structure:
Configuration
Active Configuration: Quick selector for build configurations
Board: Change target board (Zephyr Projects)
Toolchain: Switch between registered toolchains
Actions
Build: Compile the project
Clean: Remove build artifacts
Clean and Rebuild: Clean then build
Flash: Load firmware to the board (Zephyr Projects)
Configure: Configure the project (Bare-metal CMake Projects)
Debug: Open Debug Configuration Panel
Stop Task: Cancel a running build / configure / clean / flash (visible only while a task is running)
KConfig Config: Run
menuconfigorguiconfig(Zephyr projects, and CMake projects withmenuconfig/guiconfigtargets)
Documentation: Text, RST, and MD files
Header Files: All
.hfilesSource Files: All
.cfilesOutput Files: Build outputs (
*.elf,*.map,*.dts,.config)Components: All source files compiled into the final output
Configuration: Kconfig and DeviceTree files (Zephyr Projects)
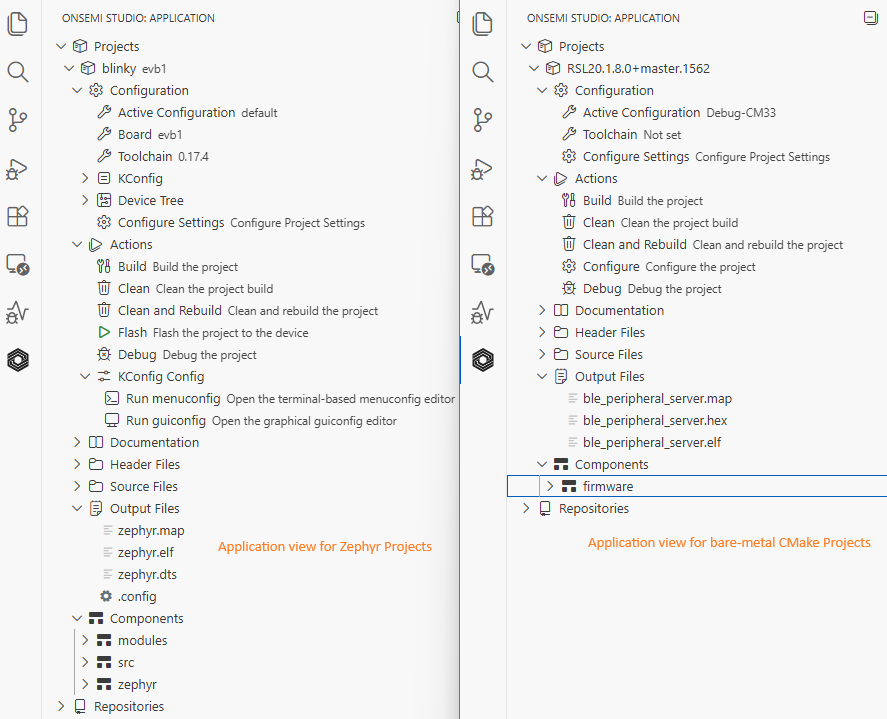
Fig. 8 Application view showing project structure and actions
Switching the Active Configuration
The Active Configuration determines which build configuration (board, args, environment, preset) is used when you Build, Clean, Configure, Flash, or Debug a project.
To change it from the Application View:
Expand Projects → <your application name> → Configuration → Active Configuration.
Click Active Configuration. A Quick Pick menu appears listing all configurations defined under
onsemi.build.configurationsin the project’s.vscode/settings.json.Select the desired configuration. The Application View updates to reflect the new active configuration, and subsequent project actions use it.
You can also change the active configuration from the Configure Settings panel:
Expand Projects → <your application name> → Configuration → Configure Settings.
In the panel, under Build Configurations, toggle the Active switch (or radio button) on the desired configuration.
Click Save at the top of the panel.
Important
Changes made in the Configure Settings panel are not applied until you click Save. Unsaved changes are kept only in the panel.
Pristine Build Mode (Zephyr)
For Zephyr build configurations, each entry under onsemi.build.configurations accepts a pristine property that controls whether west build re-runs CMake from scratch:
"auto"(default) — Re-run CMake only when inputs (board, overlays,prj.conf, etc.) change. Fastest for incremental development."always"— Always wipe the build directory before configuring. Use this when you have changed something CMake’s auto-detection cannot see (for example, you moved or renamed the project on disk and the build directory’s cached source path is now stale)."never"— Never wipe; reuse the existing build directory unconditionally.
You can change pristine from the Configure Settings panel (per build configuration) or by editing .vscode/settings.json directly.
Project Terminal
Open an integrated terminal with your project’s environment already configured:
Command: Right-click project folder → “Open Terminal”
The terminal automatically configures:
PATH Environment: Starts from the system/user PATH inherited by VS Code, with the active project’s repository tools (registered under
onsemi.repositories) prepended. The terminal uses a strict environment, so tool entries from other repositories registered in your settings do not leak into this terminal’s PATH. This guarantees the project sees the exact tool versions configured for its own repository (e.g. its own CMake, Ninja, and toolchain), while system-wide tools (Git, Python, etc.) remain available.Python Virtual Environment: Auto-activated for projects (if configured in
.vscode/settings.json)Project Environment Variables: All project-specific variables from settings
Working Directory: Set to your project root
Configure Project Settings
For more control over project settings:
Expand your project in the Application View
Under Configuration, click “Configure Settings”
The Configure Project Settings Panel opens
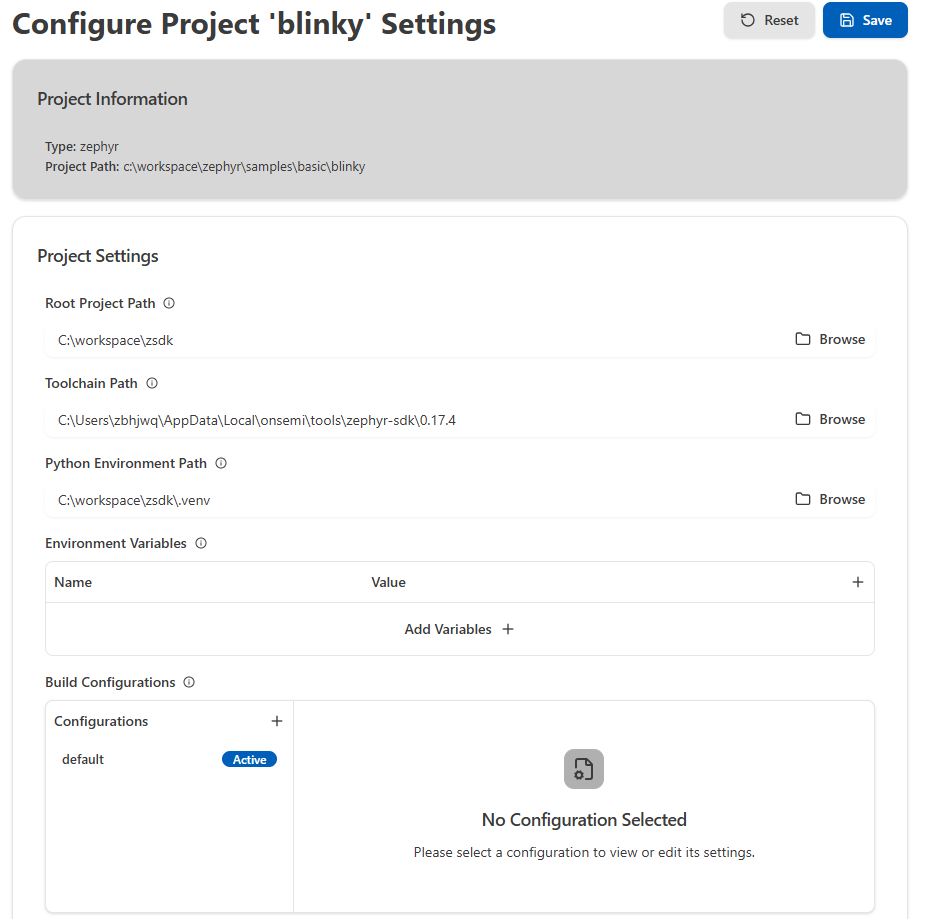
Fig. 9 Configure Project Settings panel
The panel provides:
Root Project Path: Points to the root project directory
Toolchain Path: Path to your toolchain installation
Python Environment Path: Path to the virtual environment folder
Build Configurations: Manage multiple build configurations
Add new configurations using the “+” button
Clone existing configurations using the “Clone” button
Toggle Active switch to set the active configuration
Configure build-specific settings (board, sysbuild, pristine mode, args, environment variables)
Save Changes: Click the “Save” button after making changes
Debugging Your Application
Prerequisites
J-Link debugger connected to your target board
J-Link GDB Server (
JLinkGDBServerCL.exe) must be in system PATH or manually specified
Quick Start Debugging
Build your project first to generate the ELF file
Select Active ELF (automatic or manual):
Automatic: The extension auto-detects and selects the ELF file from your build directory
Manual: Right-click project → Debug Files → Select Active ELF
Run the Debug command to open the Debug Configuration Panel:
Right-click project folder → onsemi: Project: Debug
The panel provides:
Configuration management (create, edit, duplicate, delete)
Visual editors for general settings, target configuration, runtime options, command customization, UART settings, and peripheral inspector
Real-time JSON preview
Task integration
Configuring Debug Settings
Target Tab
Device Name: Enter your target device name (e.g.,
Cortex-M0+)GDB Server Path: Verify the path to
JLinkGDBServerCL.exeDefault: Should be auto-detected if J-Link is in PATH
If not found, click Browse to locate it
Connection Settings:
Host:
localhost(default)Port:
2331(default)
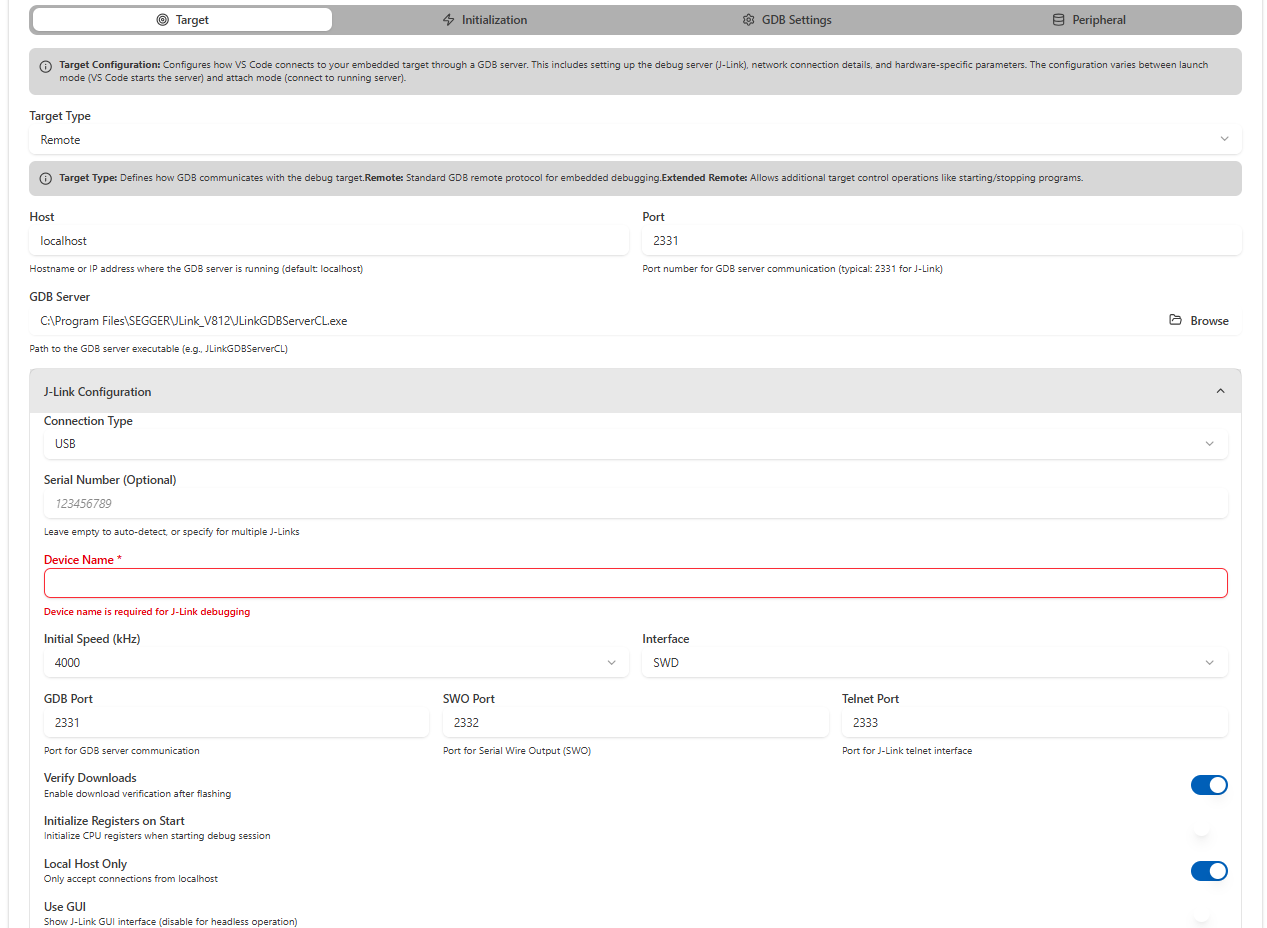
Fig. 10 Debug Configuration Panel - Target Configuration
Initialization Tab
Configure initialization settings for your target device:
Reset Command: Command sent to reset the target device
Reset Timing: Controls when the target device is reset during programming
Before Programming: Reset before loading program
After Programming: Reset after loading program
Always: Reset before and after programming
Never: No automatic reset
Important
Use “Never” when running code from RAM or when reset interferes with debug session.
Initialization Commands: Commands executed after connecting to target but before running
Command Generation Options: Automatic generation of common GDB commands
Include Load Command: Load program
loadto targetEnable Semihosting: Emits
monitor semihosting enableso target-sideprintf/ file I/O is routed through the debugger. When enabled, choose a Console Routing target:Telnet (port 2333) — output sent over the J-Link telnet port
GDB target output stream — output sent to GDB’s target output stream
GDB stdio (Debug Console) (recommended) — output appears directly in the VS Code Debug Console
Set Program Counter: Set CPU program counter to specific address or symbol (e.g.,
Reset_Handler,main, or0x08000000)Set temporary breakpoint: Set temporary breakpoint
tbreakat a function name (e.g.,main)Output display format: Controls how GDB displays numeric values (addresses, register contents, etc.)
Generated Commands Preview: Shows the actual GDB commands that will be executed
Additional Commands: Enter custom GDB commands to execute after the generated commands
Pre-Run Commands: Commands executed after loading the program but before start of execution
Additional Commands: Enter the actual GDB commands to send
Custom Reset Commands: Enter custom reset commands when standard reset is insufficient
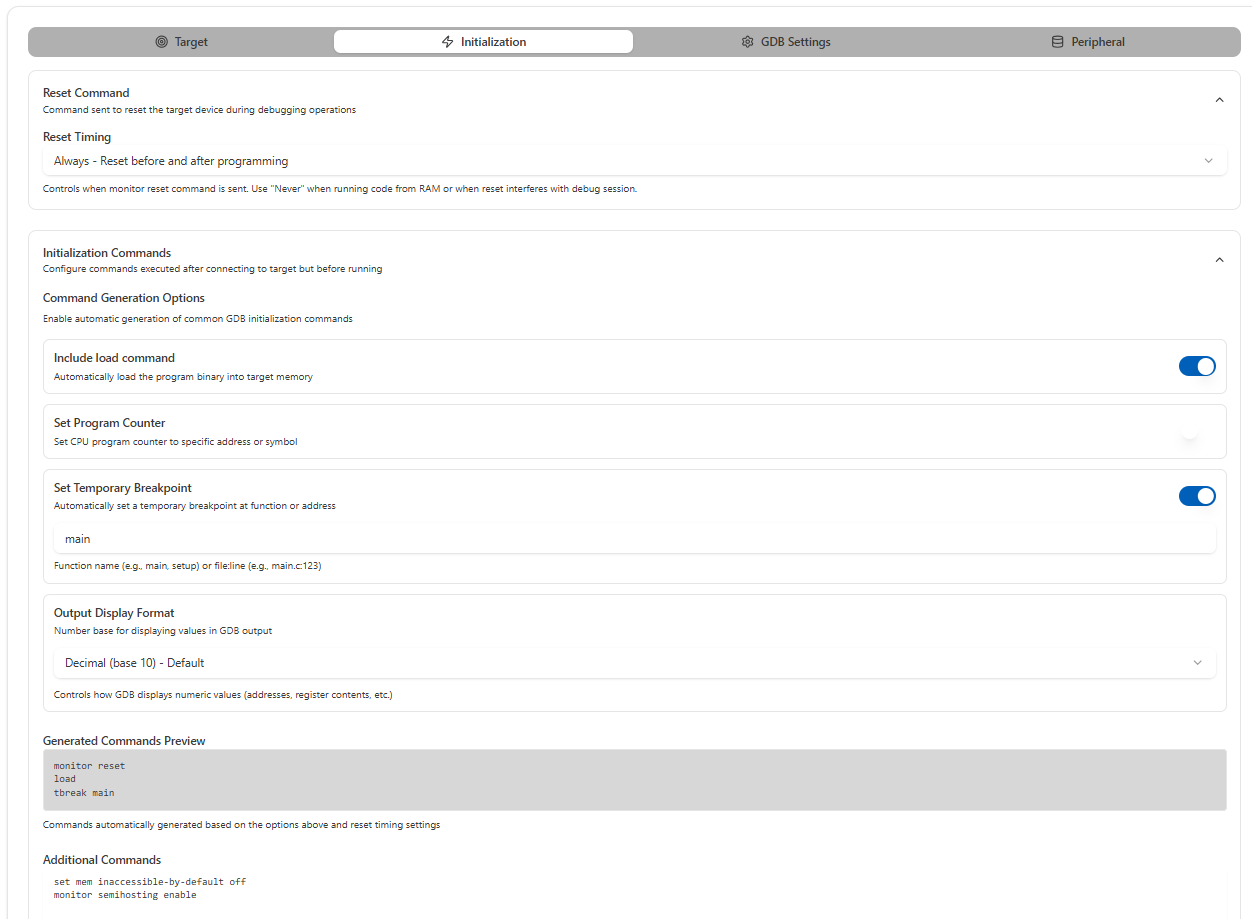
Fig. 11 Debug Configuration Panel - Initialization Commands
GDB Settings Tab
Debugger Executable: Verify path to GDB executable
Should point to your toolchain’s GDB (e.g.,
arm-zephyr-eabi-gdb.exe,arm-none-eabi-gdb.exe)Click Browse if you need to change it
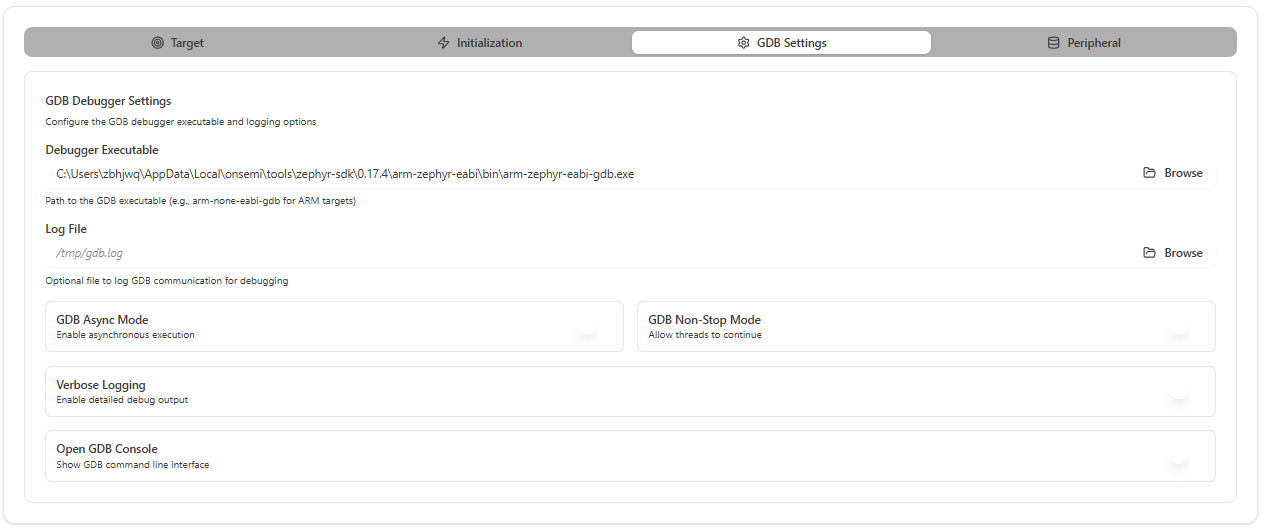
Fig. 12 Debug Configuration Panel - GDB Settings
Peripheral Tab
Configure SVD (System View Description) file for viewing and debugging microcontroller peripheral registers during debug sessions:
SVD File Path: Browse and select the SVD file for your target device
SVD files provide detailed register layouts and bit field descriptions
Enables viewing and modifying peripheral registers in real-time during debugging
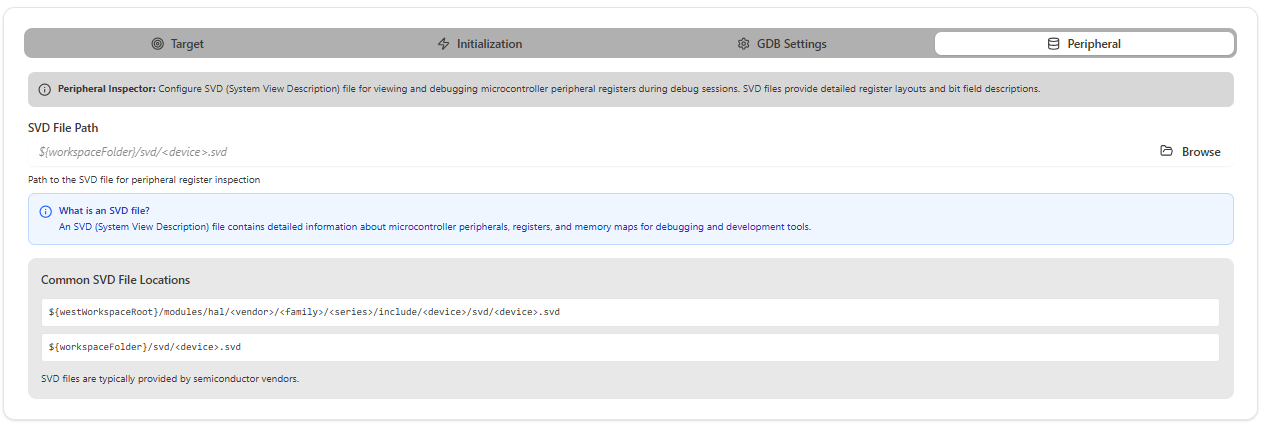
Fig. 13 Debug Configuration Panel - Peripheral Inspector
Starting the Debug Session
Program Path: The extension automatically resolves the active ELF file path. You can use the variable
${command:onsemi.getActiveElfPath}or specify a workspace-relative path using${workspaceFolder}.Click “Start Debugging” to debug the program (with breakpoints)
Click “Run Program” to flash the program without debugging
Note
Selecting Active ELF File: When multiple ELF files are present in your project, use the bottom status bar to select the active ELF file for debugging. If the Debug Configuration panel is already open when you change the active ELF in the status bar, you must save the Debug Configuration for the panel to display the updated ELF path.
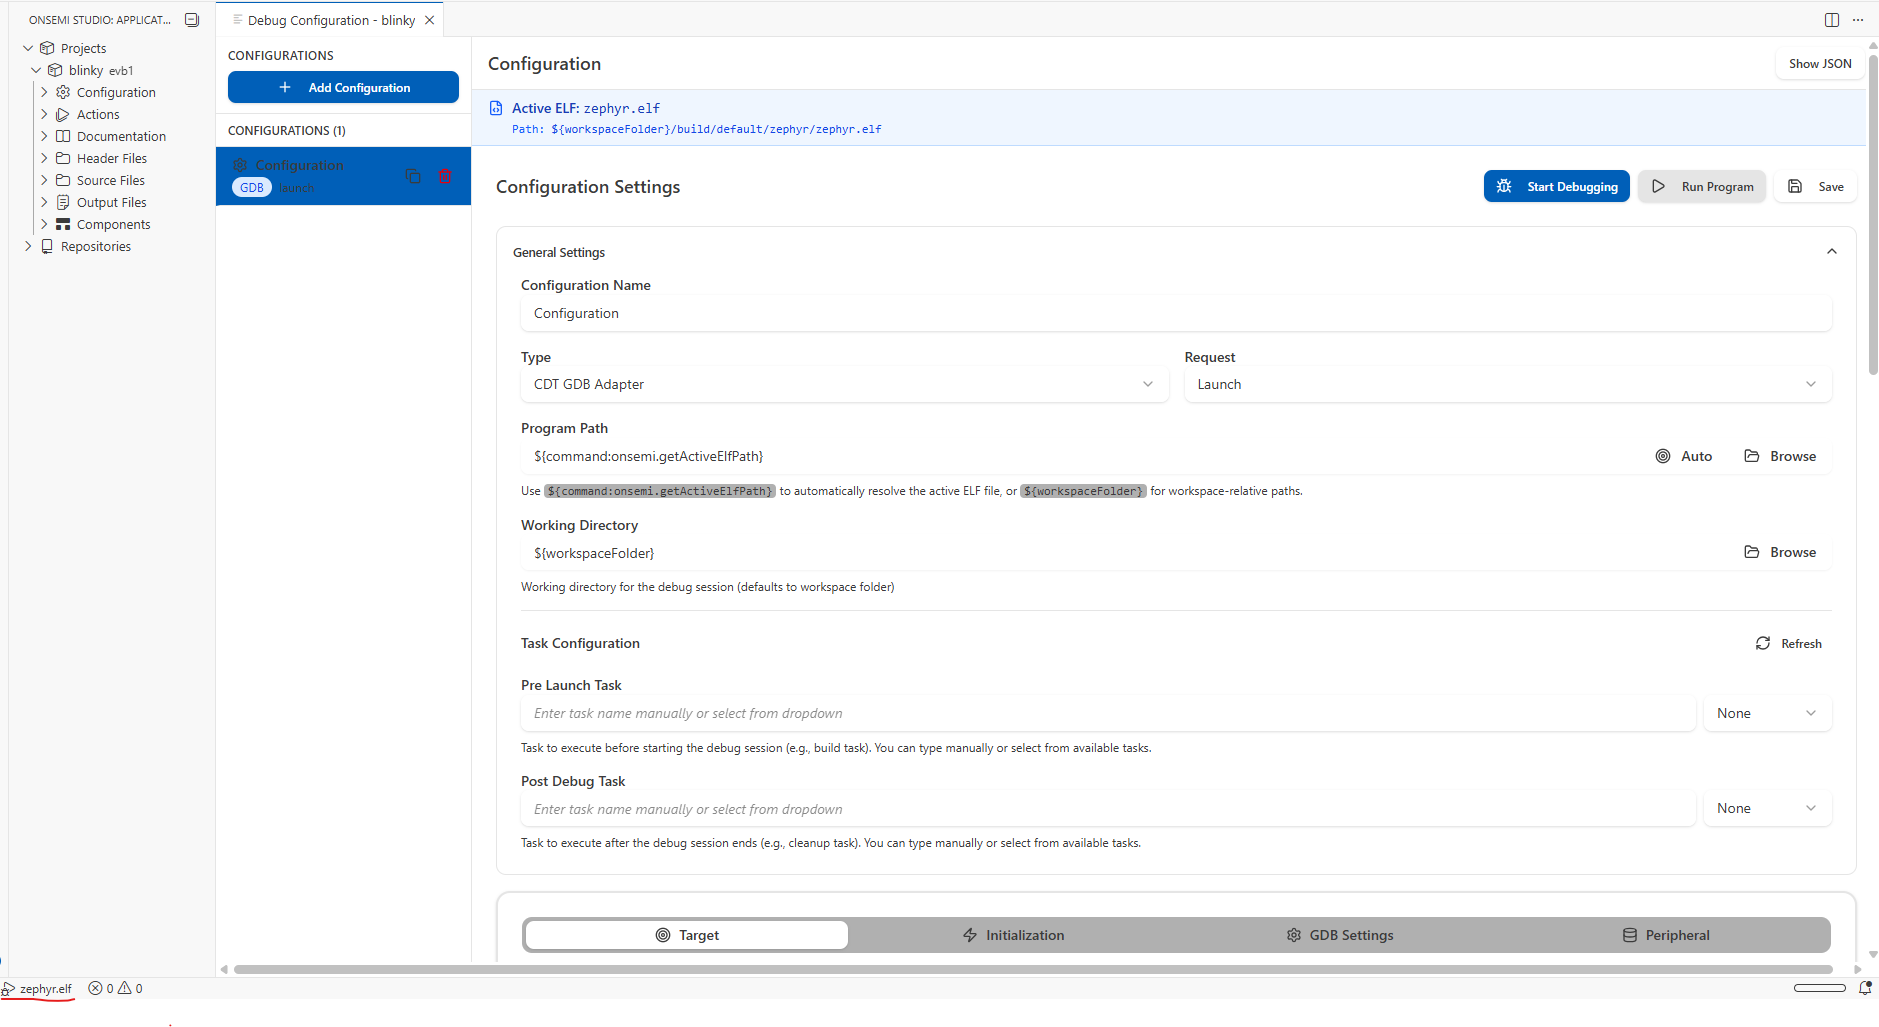
Fig. 14 Start debugging
Troubleshooting Debug Issues
If program fails to load:
Verify GDB Server Path points to correct
JLinkGDBServerCL.exeCheck Debugger Executable in the GDB Settings Tab points to the correct GDB
Ensure your J-Link debugger is connected and detected
Try debugging again